Search
In a fast-paced business landscape, maintaining strategic focus amid daily demands can be daunting. Visual dashboards offer a bridge between long-term goals and daily operations, ensuring every team member sees how their work supports overarching objectives. By transforming raw data into intuitive displays, organizations can foster a culture where strategic priorities remain ever-present.
Many companies struggle to keep strategy at the forefront of day-to-day activities. Reports get buried in inboxes, presentations become static slides, and vital objectives lose visibility over time. Without a dynamic tool to link metrics to strategic aims, teams risk drifting into reactive behaviors rather than proactive, goal-oriented action.
Executives often lament a lack of alignment, while frontline employees feel detached from high-level targets. This disconnect undermines morale and stalls progress. To overcome these hurdles, leaders need a solution that turns abstract plans into tangible, visual performance insights and aligns every layer of the organization.
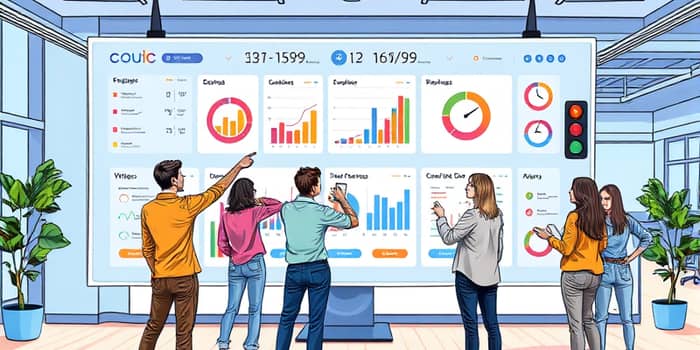
Visual dashboards serve as a centralized hub for essential performance metrics, offering live, real-time performance visibility. They replace static spreadsheets with interactive displays that highlight trends, anomalies, and progress toward key goals. When everyone sees the same data, conversations shift from conjecture to informed analysis.
By embedding dashboards into regular meetings, teams develop a rhythm of data review that keeps strategy top-of-mind and drives continuous improvement.
Different roles require distinct dashboards to support strategic management effectively. Choosing the right type ensures every stakeholder gains the insight needed to drive performance.
KPI dashboards highlight critical metrics, executive views provide a holistic overview, and operational tools empower frontline teams to act immediately on emerging data.
Well-crafted dashboards balance clarity with depth, ensuring users can grasp essential information at a glance while having the option to dive deeper when needed. Avoid clutter and focus on key visual cues.
Consistent color schemes, clear labeling, and logical layout guide users through the narrative of progress, challenges, and opportunities.
Rolling out dashboards requires careful planning and ongoing support to drive adoption. Begin with clear alignment between metrics and strategic objectives. Engage stakeholders early to define relevant KPIs and ensure data quality.
Regularly review dashboard performance and user feedback to refine design, add new insights, and retire irrelevant metrics.
Studies by the World Bank demonstrate that well-designed dashboards boost cross-departmental collaboration and data literacy, accelerating program delivery and fostering an agile culture. Organizations adopting dashboards report faster reaction times, with issues identified and addressed in hours rather than days.
Quantitative metrics show a reduction in manual reporting efforts by up to 70%, allowing teams to allocate resources toward strategic tasks. Senior leaders cite improved decision-making agility, while frontline managers appreciate the transparency and accountability dashboards bring to daily operations.
Despite their benefits, dashboards can falter if overloaded with unnecessary visuals or poorly integrated into workflows. Common mistakes include displaying too many metrics, using inconsistent chart types, or ignoring user experience.
To avoid these pitfalls, adopt a continuous improvement approach: gather user feedback, monitor usage patterns, and iterate on design. Prioritize metrics that drive behavior, and be bold about removing charts that no longer serve strategic goals.
As data volumes grow and business environments become more complex, visual dashboards will continue evolving with advanced analytics, AI-driven insights, and predictive modeling. The organizations that master these tools will gain a decisive edge, turning strategy from a static document into a dynamic, living framework.
By embedding visual dashboards into the fabric of your operations, you create a culture where strategy isn’t just discussed—it’s seen, measured, and achieved every day.